Downtime. Everybody needs a little downtime after putting in 40, 50, 60 hours of work during the week. What nobody needs, though, is the unexpected and unwanted downtime caused by a catastrophic failure of an important piece of equipment.
You can now reduce downtime and increase your productivity with onsite condition monitoring. Many companies currently use a broad route based monitoring system commonly referred to as “milk runs”. This method results in a lot of time wasted walking the plant to collect data. And a problem or breakdown can occur immediately after a machine has been checked out.
Onsite condition monitoring consists of selecting the most critical assets in your plant and mounting sensor nodes that monitor temperature, vibration and speed (where applicable). The data can then be accessed from the cloud either through Wi-Fi or cellular communication. For the most part this data can be accessed from any device.
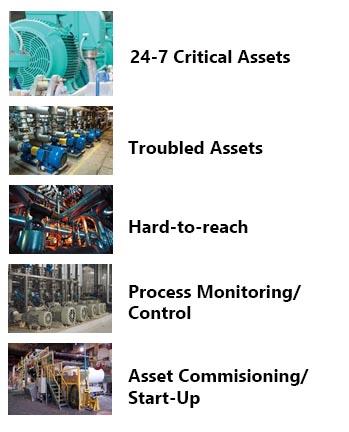
So, how does it work? Flolo will assist you in determining the best candidates in your plant for monitoring. These can include your critical assets that have a very high cost of downtime; hard to read assets in remote locations or areas that present a safety risk for your workers.
Once the monitors are installed it just becomes a matter of collecting via Wi-Fi or a cellular network the information on vibration, temperature and speed (through the use of an encoder). This data will be collected and reviewed by Flolo personnel and partner with customer personnel. A baseline will be set for each piece of equipment being monitored and we will be able to determine when a problem exists and correct it before it becomes a major disaster.
The built-in software tools allow for alarms to be set and real time data can be analyzed. We will be able to analyze with built in tools:
– Real Time waveform analysis (like an oscilloscope display) of the signal from the transducer.
– FFT Display showing the frequencies and the magnitude of the vibration signal at those frequencies.
– A Waterfall plot showing multiple FFT plots on a time scale showing the change in the waveform over time.
– An Harmonic cursor indicating all the harmonics of the base frequency.
Contact your Flolo representative today to start protecting your equipment with onsite monitoring. Or call 630-595-1010 and ask for Customer Service.